So, you are interested in taking the plunge of rolling out a Power BI solution for your company. The marketing material looks fantastic. This is going to be a piece of cake, right?
I’ll skip the fear mongering. It really isn’t that bad. We have some tips that aim to help streamline the project, help you think ahead, and budget appropriately.
Consider Identity Management: How Will You Authenticate Your End Users?
In all likelihood, your company is already using a number of Office 365 products — which means you are probably most of the way if not all of the way to managing users in Power BI. If not, there are a number of ways that you can manage end users. As the number of users in your company increases, making modifications to your underlying user systems increases in complexity. In addition to the technical changes that need to be made by your infrastructure team, some retraining of your user community may ensue as you switch options. Understanding your options for user authentication for your Power BI project ahead of time can help you make decisions on your eventual approach. Here are a few of the best options:
Use Separate Logins
Create users in Azure AD and then grant them the Power BI subscription. While this does add one extra login and password to manage for your users, it is also the fastest and the simplest way to get into the Power BI game. In fact, this is the approach Kopis took for its initial internal release. We created users in Azure AD for each person that would be using Power BI and shared the first dashboard with everyone. Since we had a small number of users for our pilot, changing to federation would not create too much additional effort down the road.
Synchronize Account Passwords
This is similar to the first option except with the exception of using the the DirSync Tool in Azure AD, which creates similar logins for all users and automatically keeps the passwords up to date with the local directory. This is a great option if you have a lot of users in a local domain, but don’t want to go through the additional hassle or infrastructure setup of federation
Use Federation Services
With Active Directory Federation Services (ADFS), you can tell Azure to trust your local directory to authenticate all your users in Power BI (or any O365 app). Although this option is slightly more difficult to set-up, it has the advantage of eliminating duplicate logins, allowing Single Sign On. In other words, when your employees are at your organization, in the office, it can pick up their Windows Tokens so they never see a login page or have to enter a username and password.
Managing Access Efficiently: Groups & Governance
Along with individual identity management, you should also think about how you will set-up groups and security for your Power BI project. How do you want to author and share your metrics? Many companies provide metrics for the leadership team, sales team, and operational team, as well as for subgroups within these categories. What will your group structure look like? Power BI leverages Office 365 groups in addition allowing individual users share and collaborate on their reports and dashboards.
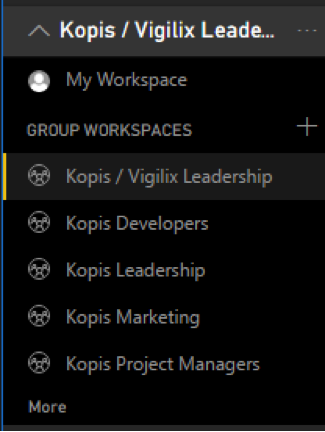
In the Kopis minimum viable product, we started with a system account we used to publish modifications from Power BI desktop and simply shared the reports and dashboards with our pilot users. After a few iterations, as our user base grew within the company, we switched to publishing reports to a group. A few iterations later, we had four groups. As soon as we increased the number of roles interacting with the reports, it just didn’t make sense to go with the quick and dirty route anymore.
As we grew the number of roles, we wanted to scale in a way to stay true to the core tenet of Power BI — collaborative data analysis. Think about what we are trying to replace here: throwaway Excel analysis of core business data. Who should be creating additional reports and adjusting the dashboards? For us, we felt that it was important that anyone could copy and modify a report to their own workspace, but it was important that core reports and dashboards deployed to the groups should not be altered by most who would consume the data. That is, it is important that developers didn’t inadvertently adjust how project metrics are calculated, but if they wanted to create their own report to understand why the velocity of a particular project was higher or lower than normal, they were free to do so.
Who should have access to the underlying data? Since your business systems are unlikely to have wide open read permissions, the users in Power BI are likely to have varying levels of access as well. Planning permissions to the underlying data affects the decision of how to pull in data from various data sources. Do you want to create multiple datasets and maintain them all as the data model changes? Or would you rather implement a table or row level security model?
If you are iterating through your implementation of Power BI, these questions might not be tasks in your minimum viable product; however; answering these questions will set the sights for your organization up into the top the BI maturity model for governance.
Establish Your Data Sources: Where Do You House Your Data And What Do You Need It To Do?
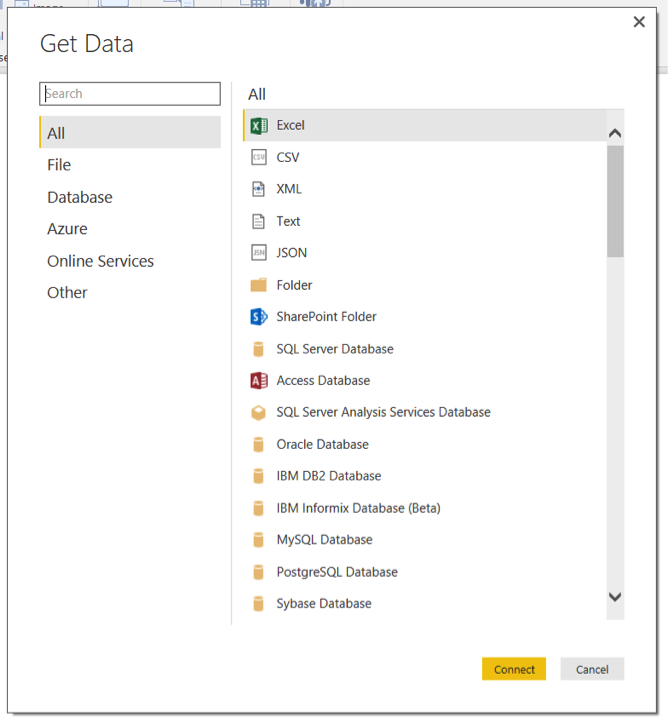
When you launch your Power BI project, it’s important to know where your data is located and your options for bringing it into Power BI. Are your data sources on-premise, in the cloud, or on a public service? Can you extract the data out of a database, analysis services cube, flat file, or web service? Does it already exist in a form that can be live queried or streamed into Power BI, like an Azure SQL database?
You should also define how you will likely be using your data and who will be analyzing your metrics. How quickly do you want the data to update on the dashboard? Be honest and practical. It will likely be different per data source. To answer this, start with asking yourself when will the source data be updated, and how often? For instance, for Kopis, our time data is the most sensitive to update lag. If someone forgets to enter their time, the dashboard should update quickly after they catch back up. This became especially important as we decreased the gap between performing work and entering time. On the flip side, sales metrics could be refreshed at a slower pace (hourly) because the data in CRM doesn’t change quite as often as our time data.
In addition to the options in Power BI Desktop, there are numerous content packs available to pull data from existing systems. We found the content packs to be extremely helpful to get up and running quickly, but once we were ready to combine data from our other sources and shape the data, pulling everything into something like an Azure database via SSIS or one of Azure’s microservices made it easier to use the more advanced features.
What are the starting metrics for each of your defined groups? What should each of those groups be looking at daily, weekly, and monthly. Will the data sources support these metrics inherently or do you need to tweak your incoming data? For example, on our first iteration of our daily and monthly dashboards, Kopis had two main categories for time: Billable and Unbillable. These correlated directly to how an employee entered their time, so it was easy to create a chart in Power BI to determine how much time everyone entered that was billable and unbillable. On our next iteration, we wanted to include a third category – Unrealizable. Deciding whether a block of time is realizable isn’t a decision someone entering time should make. That is up to the terms of the contract and the time already entered. Therefore, we needed to pre-aggregate the time and earnings. That way, billable activities that could not be invoiced would be categorized separately. Ultimately, that category was a factor on our approach for that second iteration.
Make Room For Improvement: Is Your BI Project Flexible Enough To Grow With Your Company?
One of the most important benefits of a solution like Power BI is that it’s as much a tool for discovery as it is a tool for data analytics. In other words, many companies that implement a Power BI project find more metrics that are critical as they go, uncovering key relationships and metrics they did not realize had such a strong impact on their business.
For this reason, taking a LEAN approach of getting to something useful, however small, as quickly and efficiently as possible and plan for continued improvement after you launch your Power BI project. For example, Kopis focused on its Daily Operations dashboard, the “what happened.” As we became better at understanding “why did it happen,” we became better forecasters. How did we do this? We iterated through dashboard and report improvements adding different metrics. As data continued to funnel into the system, we were able to achieve a better understand from the many viewpoints of the essentially the same information.
Looking for more Power BI information? Subscribe to our Newsletter or Follow Us on Social Media.
Looking for help with a Power BI project? Contact Us.